A Summer Day in Matlacha: The Perfect ItineraryPlanning to visit Southwest Florida some time soon? If you are not already planning to stay on wonderful Matlacha, you should consider making a day

Dated: July 23 2025
Views: 63

Foreclosure headlines are making noise again – and they’re designed to stir up fear to get you to read them. But what the data shows is actually happening in the market tells a very different story than what you might be led to believe. So, before you jump to conclusions, it’s important to look at the full picture.
Yes, foreclosure starts are up 7% in the first six months of the year. But zooming out shows that’s nowhere near crisis levels. Here’s why.
Even with the recent uptick, overall foreclosure filings are still very low. In the first half of 2025, just 0.13% of homes had filed for foreclosure. That’s less than 1% of homes in this country. In fact, it’s even far less than that at under a quarter of a percent. That’s a very small fraction of all the homes out there. But like with anything else in real estate, the numbers vary by market.
Here’s the map you need to see that shows how foreclosure rates are lower than you might think, and how they differ by local area:
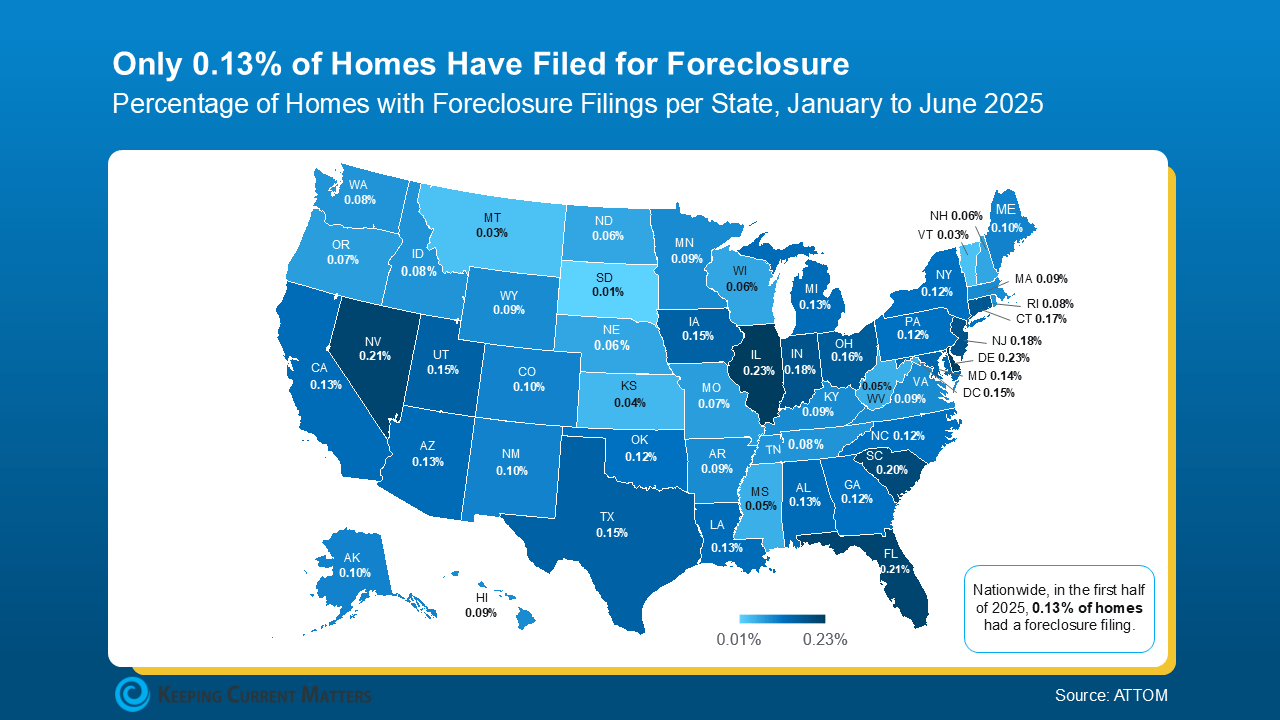
For context, data from ATTOM shows in the first half of 2025, 1 in every 758 homes nationwide had a foreclosure filing. Thats the 0.13% you can see in the map above. But in 2010, back during the crash? Mortgage News Daily says it was 1 in every 45 homes.
But here’s what everyone remembers…
Leading up to the crash, risky lending practices left homeowners with payments they eventually couldn’t afford. That led to a situation where many homeowners were underwater on their mortgages. When they couldn’t make their payments, they had no choice but to walk away. Foreclosures surged, and the market ultimately crashed.
Today’s housing market is very different. Lending standards are stronger. Homeowners have near record levels of equity. And when someone hits financial trouble, that equity means many people can sell their home rather than face foreclosure. As Rick Sharga, Founder of CJ Patrick Company, explains:
“. . . a significant factor contributing to today’s comparatively low levels of foreclosure activity is that homeowners—including those in foreclosure—possess an unprecedented amount of home equity.”
No one wants to see a homeowner struggle. But if you’re a homeowner facing hardship, talk to your mortgage provider. You may have more options than you think.
Recent headlines may not tell the whole story, but the data does. Foreclosure activity remains low by historical standards and is not a sign of another crash.
If you’re simply watching the market and want to understand what’s really going on, or how this impacts the value of your home, connect with an agent. They’ll help you separate fact from fear by showing you what the data really says.
I am a Real Estate Veteran and a top producer who is passionate about all things real estate and especially the beautiful market of sunny Southwest Florida. Whether you are looking for a vacation h....
A Summer Day in Matlacha: The Perfect ItineraryPlanning to visit Southwest Florida some time soon? If you are not already planning to stay on wonderful Matlacha, you should consider making a day
10 Hacks to Make Moving EasierIs it your first time moving, and you have no idea where to begin? Perhaps you are a seasoned mover, like many military families, and you are in search of some new
Six Suggestions for HomebuyersThinking about buying a home and not sure where to begin? Fear not! I’ve got six things you can do to get the ball rolling. Having these done before you start
The Best Parks in Cape CoralCape Coral is world-renowned as a "Boater’s Paradise," and with over 400 miles of winding canals, it’s easy to see why life here usually revolves around the
 Copyright © MFRMLS.com All information deemed reliable but not guaranteed. All properties are subject to prior sale, change or withdrawal. Neither listing broker(s) or information provider(s) shall be responsible for any typographical errors, misinformation, misprints and shall be held totally harmless. Listing(s) information is provided for consumers personal, non-commercial use and may not be used for any purpose other than to identify prospective properties consumers may be interested in purchasing. Information on this site was last updated Last updated on September 22, 2026 6:57 PM UTC The listing information on this page last changed on Last updated on September 22, 2026 6:57 PM UTCd. The data relating to real estate for sale on this website comes in part from the Internet Data Exchange program of MFR MLS.
All information deemed reliable but not guaranteed. All properties are subject to prior sale, change or withdrawal. Neither listing broker(s) or information provider(s) shall be responsible for any typographical errors, misinformation, misprints and shall be held totally harmless. Listing(s) information is provided for consumers personal, non-commercial use and may not be used for any purpose other than to identify prospective properties consumers may be interested in purchasing.
Updated on September 22, 2026 6:57 PM UTC
Copyright © MFRMLS.com All information deemed reliable but not guaranteed. All properties are subject to prior sale, change or withdrawal. Neither listing broker(s) or information provider(s) shall be responsible for any typographical errors, misinformation, misprints and shall be held totally harmless. Listing(s) information is provided for consumers personal, non-commercial use and may not be used for any purpose other than to identify prospective properties consumers may be interested in purchasing. Information on this site was last updated Last updated on September 22, 2026 6:57 PM UTC The listing information on this page last changed on Last updated on September 22, 2026 6:57 PM UTCd. The data relating to real estate for sale on this website comes in part from the Internet Data Exchange program of MFR MLS.
All information deemed reliable but not guaranteed. All properties are subject to prior sale, change or withdrawal. Neither listing broker(s) or information provider(s) shall be responsible for any typographical errors, misinformation, misprints and shall be held totally harmless. Listing(s) information is provided for consumers personal, non-commercial use and may not be used for any purpose other than to identify prospective properties consumers may be interested in purchasing.
Updated on September 22, 2026 6:57 PM UTC
33. Required DMCA Notice
The Digital Millennium Copyright Act of 1998, 17 U.S.C. §512, the DMCA, provides recourse for copyright owners who believe that material appearing on the Internet infringes their rights under U.S. copyright law. If you believe in good faith that any content or material made available in connection with our website or services infringes your copyright, you (or your agent) may send us a notice requesting that the content or material be removed, or access to it blocked. Notices must be sent in writing by email to DMCAnotice@MLSGrid.com. The DMCA requires that your notice of alleged copyright infringement include the following information: (1) description of the copyrighted work that is the subject of claimed infringement; (2) description of the alleged infringing content and information sufficient to permit us to locate the content; (3) contact information for you, including your address, telephone number and email address; (4) a statement by you that you have a good faith belief that the content in the manner complained of is not authorized by the copyright owner, or its agent, or by the operation of any law; (5) a statement by you, signed under penalty of perjury, that the information in the notification is accurate and that you have the authority to enforce the copyrights that are claimed to be infringed; and (6) a physical or electronic signature of the copyright owner or a person authorized to act on the copyright owners behalf. Failure to include all of the above information may result in the delay of the processing of your complaint.
 © 2026 Florida Gulf Coast MLS (FGCMLS) Information deemed reliable, but not guaranteed. The IDX data relating to real estate for sale on this web site comes in part from the Florida Gulf Coast Multiple Listing Service. The information being provided is for consumers' personal, non-commercial use and may not be used for any purpose other than to identify prospective properties consumers may be interested in purchasing. Information is deemed reliable but not guaranteed.
